Stellar magnetic activity
I am exploring mechanisms for emergence and transport of magnetic fields in (especially solar-type) cool stars, in comparison with observations. Here are some results below (backward in time).
Papers in review (opens in new tab):
Boosting starspot mapping with high-cadence photometry (2025)
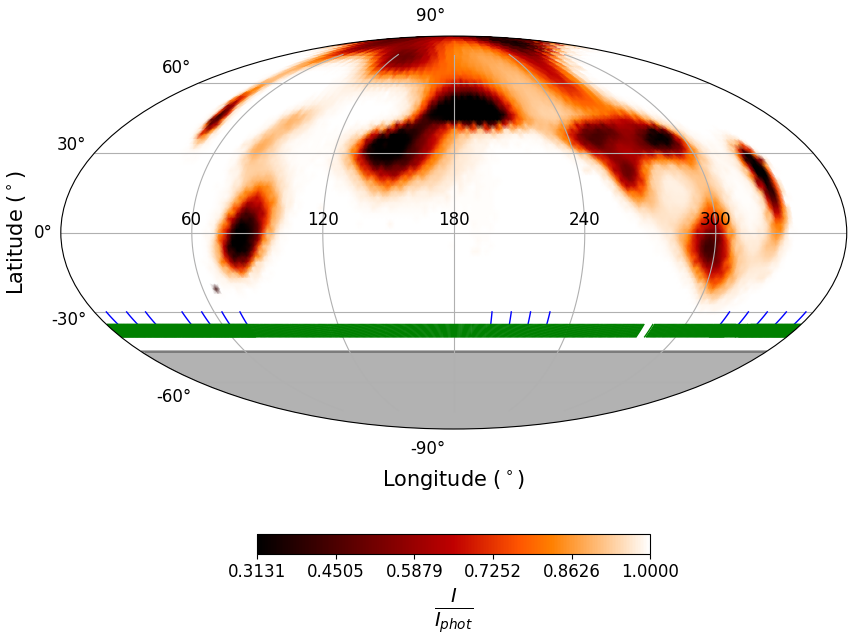
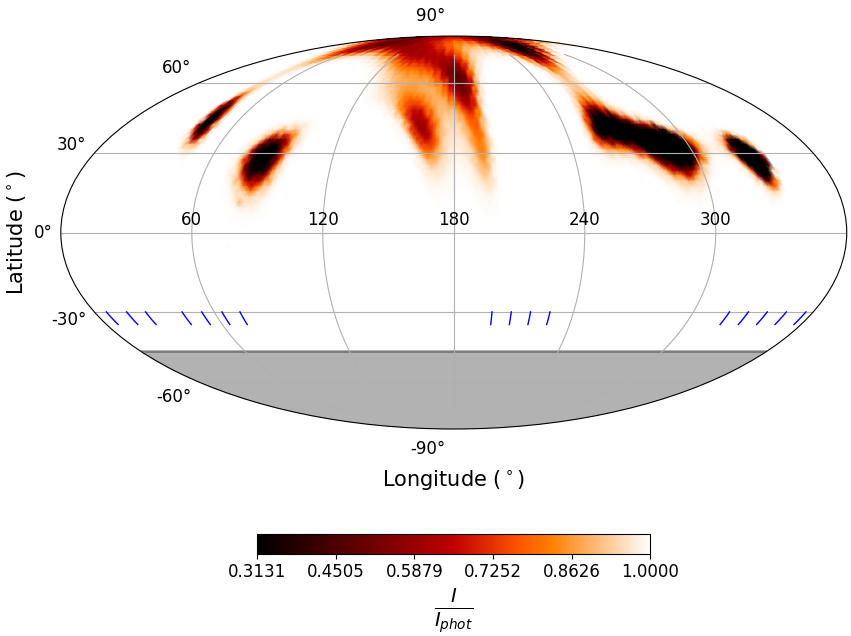
Mapping the distribution of starspots across a star’s surface is useful for understanding stellar magnetic fields and their connection to flare activity. Traditional Doppler imaging analyses how starspots distort spectral line profiles as the star rotates, but struggles to recover spots at low latitudes and in the less-visible hemisphere. Light-curve modeling tracks brightness variations as spots rotate in and out of view, but cannot uniquely determine spot latitudes. We present the first study combining both techniques simultaneously for the young, rapidly rotating K2-type star PW Andromedae. Using high-resolution GAOES-RV spectra from the 3.8 m Seimei telescope alongside continuous TESS photometry, we updated SpotDIPy (Bahar et al. 2024, see below) so that it now supports joint spectroscopic and photometric inversions. The combined approach reveals significant spot features at mid-to-low latitudes and even in the southern hemisphere (left panel), where spectroscopy-only reconstructions fail due to weak line-profile signatures (right panel). Our injection-recovery tests confirm that adding high-cadence photometry dramatically improves latitude recovery and spot area estimates, especially under realistic conditions with incomplete rotational phase coverage and moderate signal-to-noise ratios. The reconstruction shows ~9.9% of the visible surface is covered by cool spots. By comparing the spot map with TESS flare detections, we find potential associations between flare timing and activity patterns, demonstrating how improved surface mapping helps localise magnetic energy release events on active stars.
Reference
Lee, S., Bahar, E., Şenavcı, H.V., Işık, E., Ikuta, K., Namekata, K., Nagata, H., Kawauchi, K., Omiya, M., Izumiura, H., Tajitsu, A., Sato, B., Honda, S., Nogami, D. 2025, A&A, in press, arXiv:2511.12190
Asteroseismic constraints on stellar rotation-activity relationship (2025)
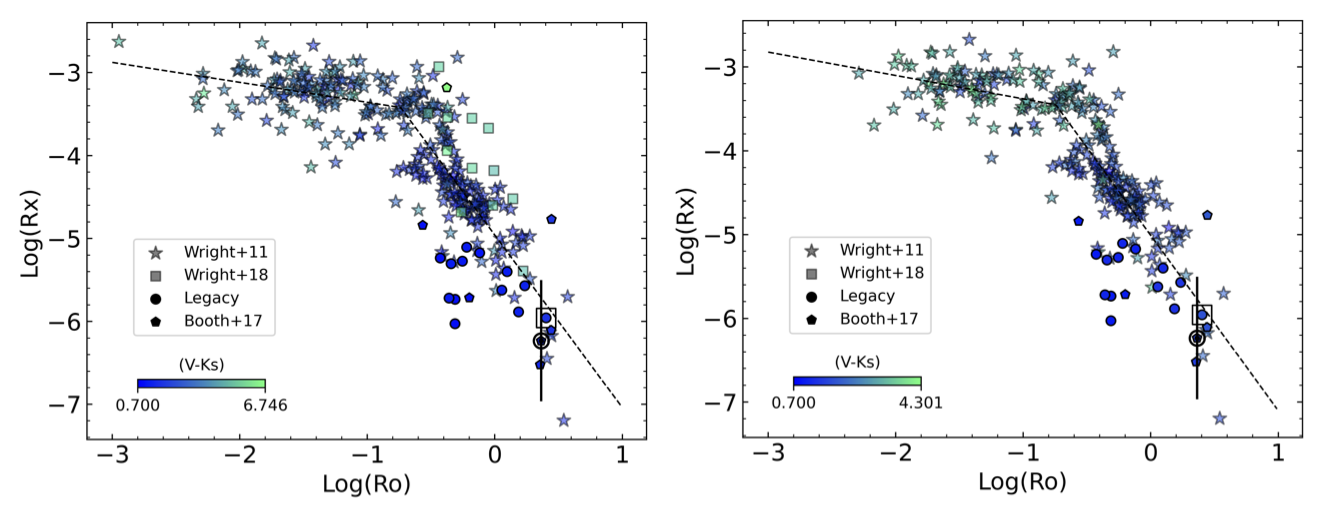
Understanding how stellar magnetic activity evolves with rotation and age provides key insights into the dynamos that generate magnetic fields in Sun-like stars. We assembled the largest sample of solar-like stars with high-precision ages from asteroseismology (measuring stellar oscillations to determine internal structure), measured rotation periods, and X-ray detections, which trace coronal heating by magnetic fields. By cross-matching the Kepler LEGACY sample (66 stars with the highest-quality oscillation data available until PLATO launches) with SRG/eROSITA all-sky X-ray survey observations, we identified 13 detections (filled circles in the figure). Using the Forward and Inversion COmbination procedure, we derived stellar masses, radii, and ages with unprecedented precision. We then recalibrated fundamental relationships linking X-ray activity to stellar age and rotation, finding improved agreement with theoretical predictions for most of our sample. The figure shows how the fractional X-ray luminosity varies with the Rossby number (rotation period relative to convective turnover timescale) – a key diagnostic of dynamo efficiency. Interestingly, while our evolved late-F-type stars rotate more slowly than standard magnetic braking models predict, invoking a weakened braking regime for old stars is not strictly necessary to explain our observations. This work demonstrates how combining asteroseismology with multi-wavelength observations helps disentangle the complex connections between age, rotation, and magnetism in aging solar-type stars.
Reference
Pezzotti, C., Bétrisey, J., Buldgen, G., M. Gilfanov, I. Bikmaev, R. Sunyaev, Işık, E., Gosset, E., Wright, N.J. 2025, A&A, in press, arXiv:2512.14517
How can a young and fast Sun have low-latitude spots? (2024)
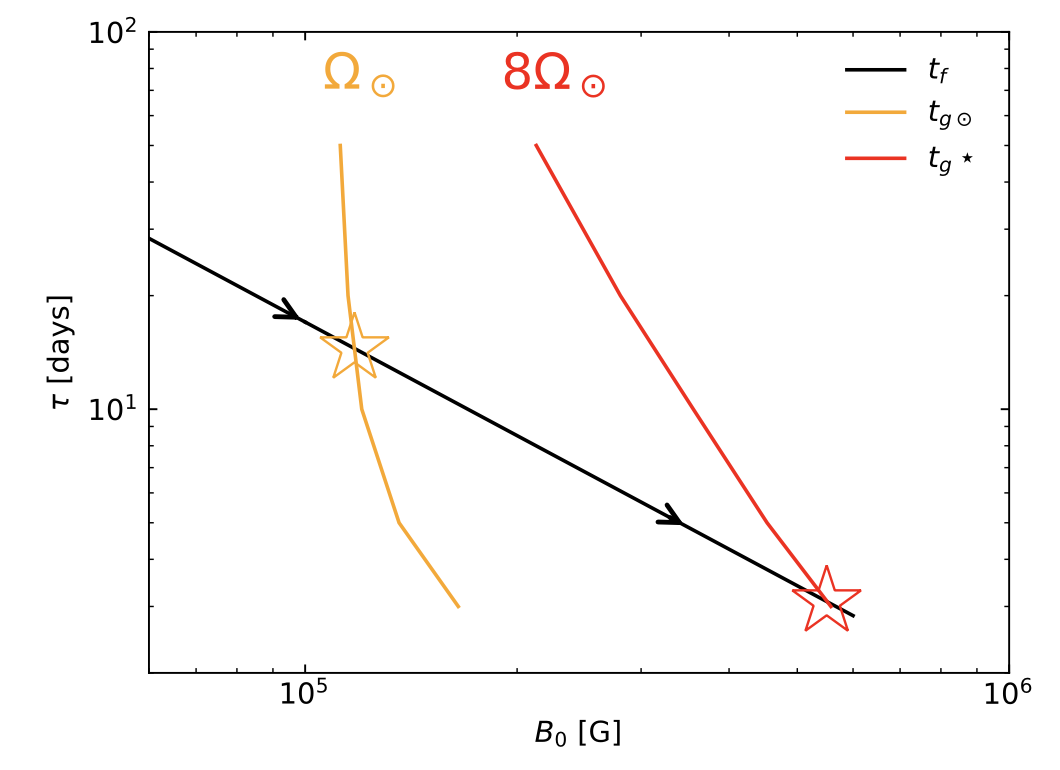
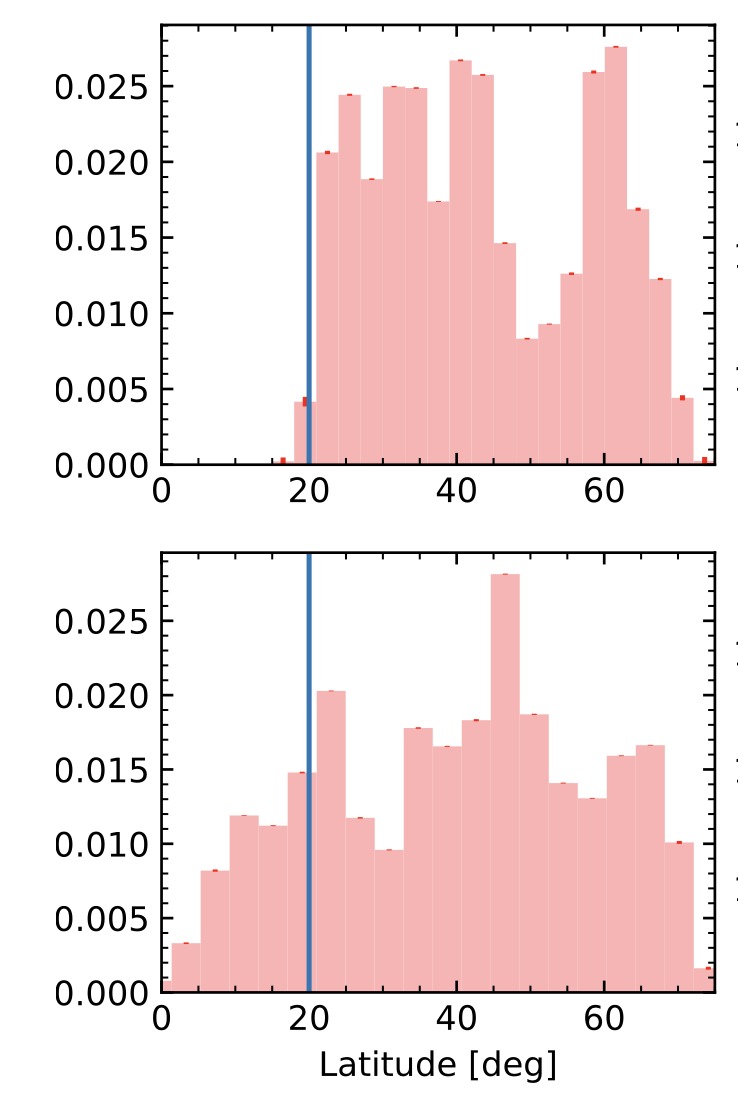
How do starspots on rapidly rotating solar-type stars emerge at so low latitudes? So far, the theoretical expectations were not consistent with the observations, because models predicted large poleward deflections for rising flux tubes, so strongly that no spot would emerge between ±20˚ latitudes about the equator. Based on an evaluation of storage timescales and numerical simulations of Parker-unstable flux tubes, we propose here a mechanism that accounts for near-equatorial emergence of rising flux tubes amid 8 times the solar rotation rate. The left-hand figure shows a comparison of the flux-tube intensification timescale as a function of the field strength of a tube being stored near the bottom of the convection zone. The right-hand figures show how flux tubes with an initially random latitudinal distribution at the base are mapped to the surface, for near-critical tubes with relatively low field strength (top panel) and for super-critical tubes leading to a near-equatorial tail in the ‘spot emergence’ distribution at the surface, similar to many Doppler imaging results.
Reference
Işık, E., Solanki, S.K., Cameron, R.H., Shapiro, A.I. 2024, Astrophys. J. 976, 215
Photospheric/chromospheric activity of PW And and a new Doppler imaging code: SpotDIPy (2024)
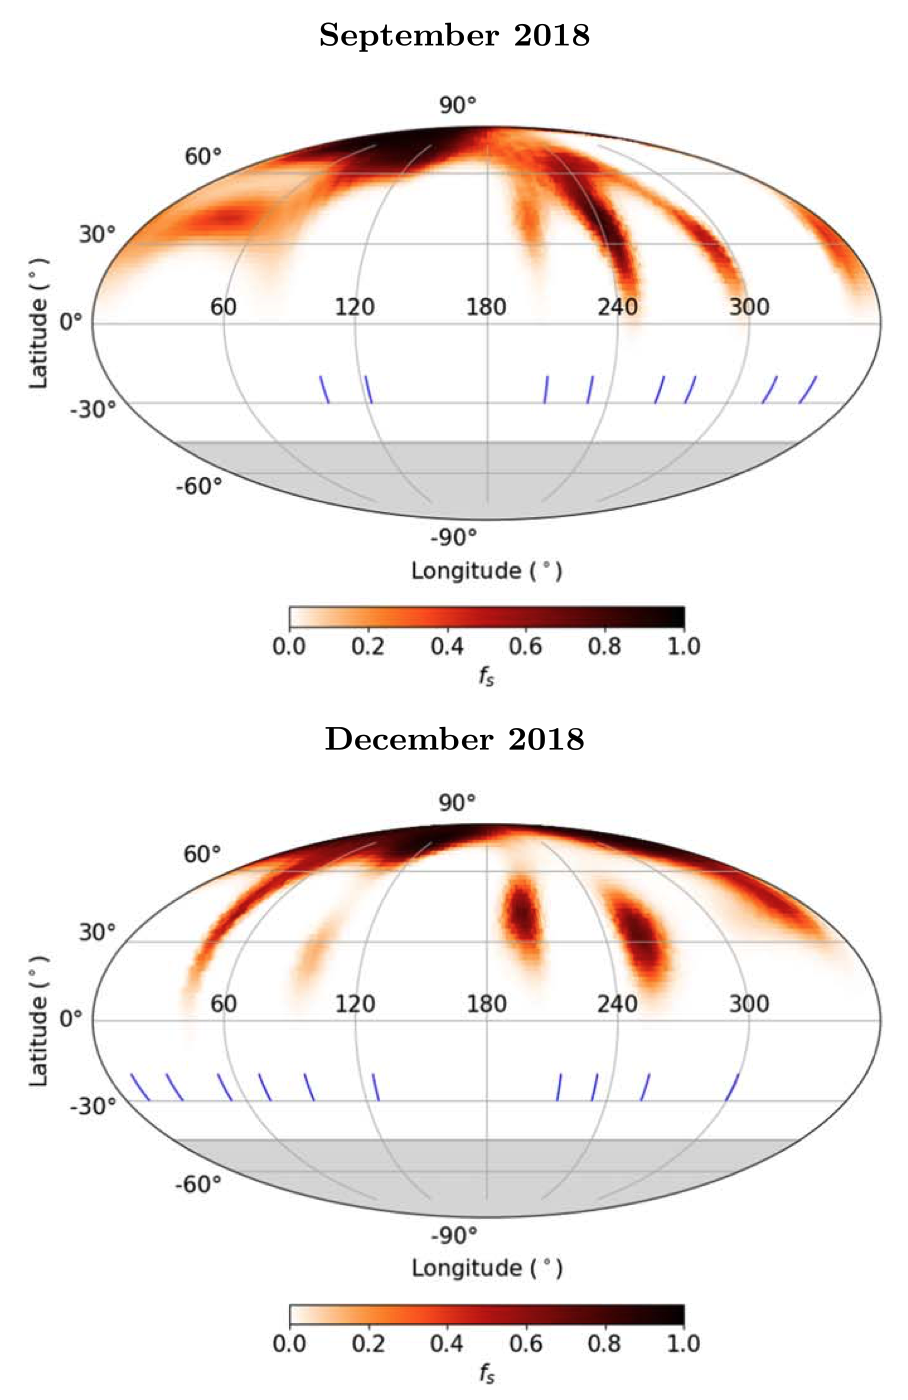
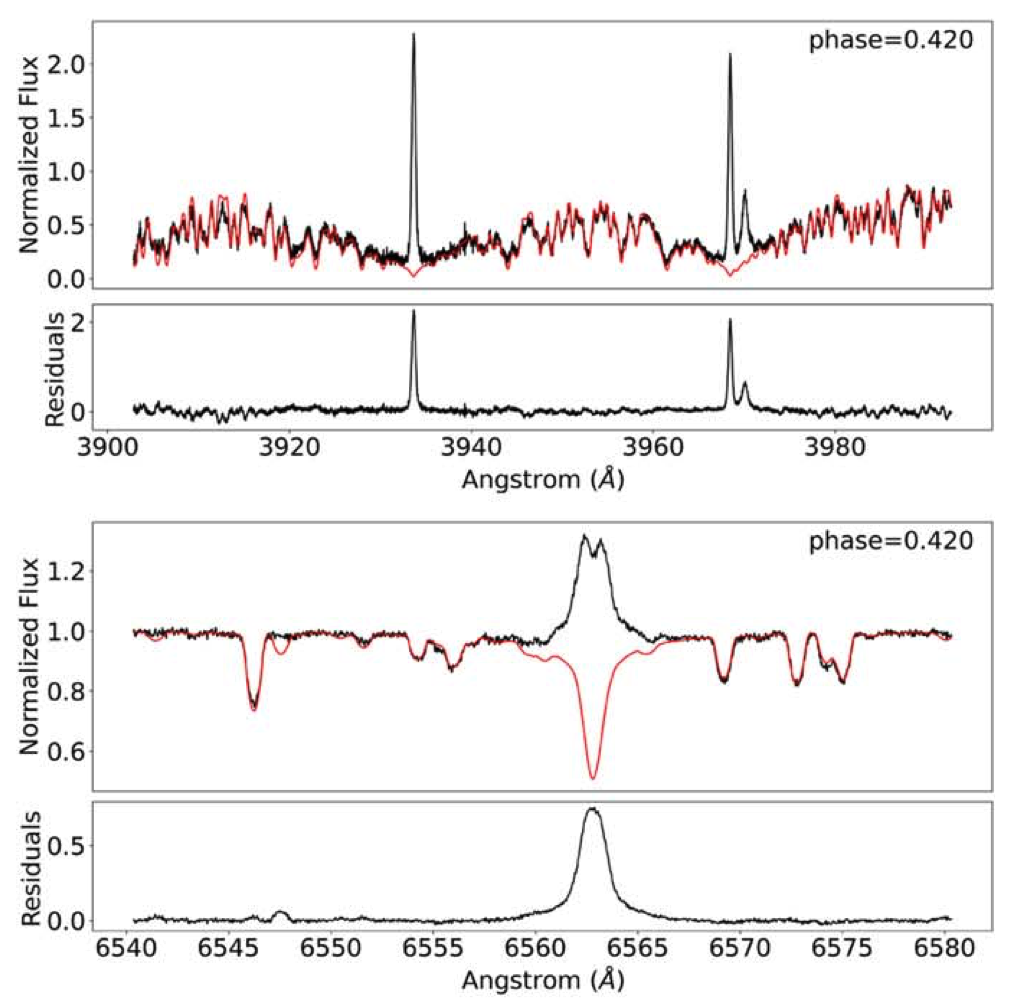
The left panel shows Doppler images of PW And, generated by SpotDIPy, for two epochs. The right panel shows Ca II H & K lines and H-alpha in strong emission, along with the subtraction of photospheric model spectra, revealing excess emission from the chromosphere.
We focused on three activity proxies of the young K2V star PW Andromedae rotating at a period of 1.72 d. Doppler imaging of starspots, TiO-band analysis of starspots, and the associated chromospheric activity, using high-resolution spectroscopy. We found that the starspot distribution from line-profile inversions are consistent with the TiO-band profiles and the chromospheric emission also follows the photospheric magnetic activity pattern. We introduced a new Doppler imaging code SpotDIPy in Python, which allows surface reconstructions of starspots using the maximum entropy approach. In the upcoming version of the code, there will be the option of simultaneous multicolour-photometric and spectroscopic inversion.
Reference
Bahar, E., Şenavcı, H.V., Işık, E., Hussain, G.A.J., Kochukhov, O., Montes, D, Xiang, Y. 2024. Astrophys. J., 960, 60
Forward modelling brightness variability in solar-type stars (2023)
Application #4 of the FEAT model
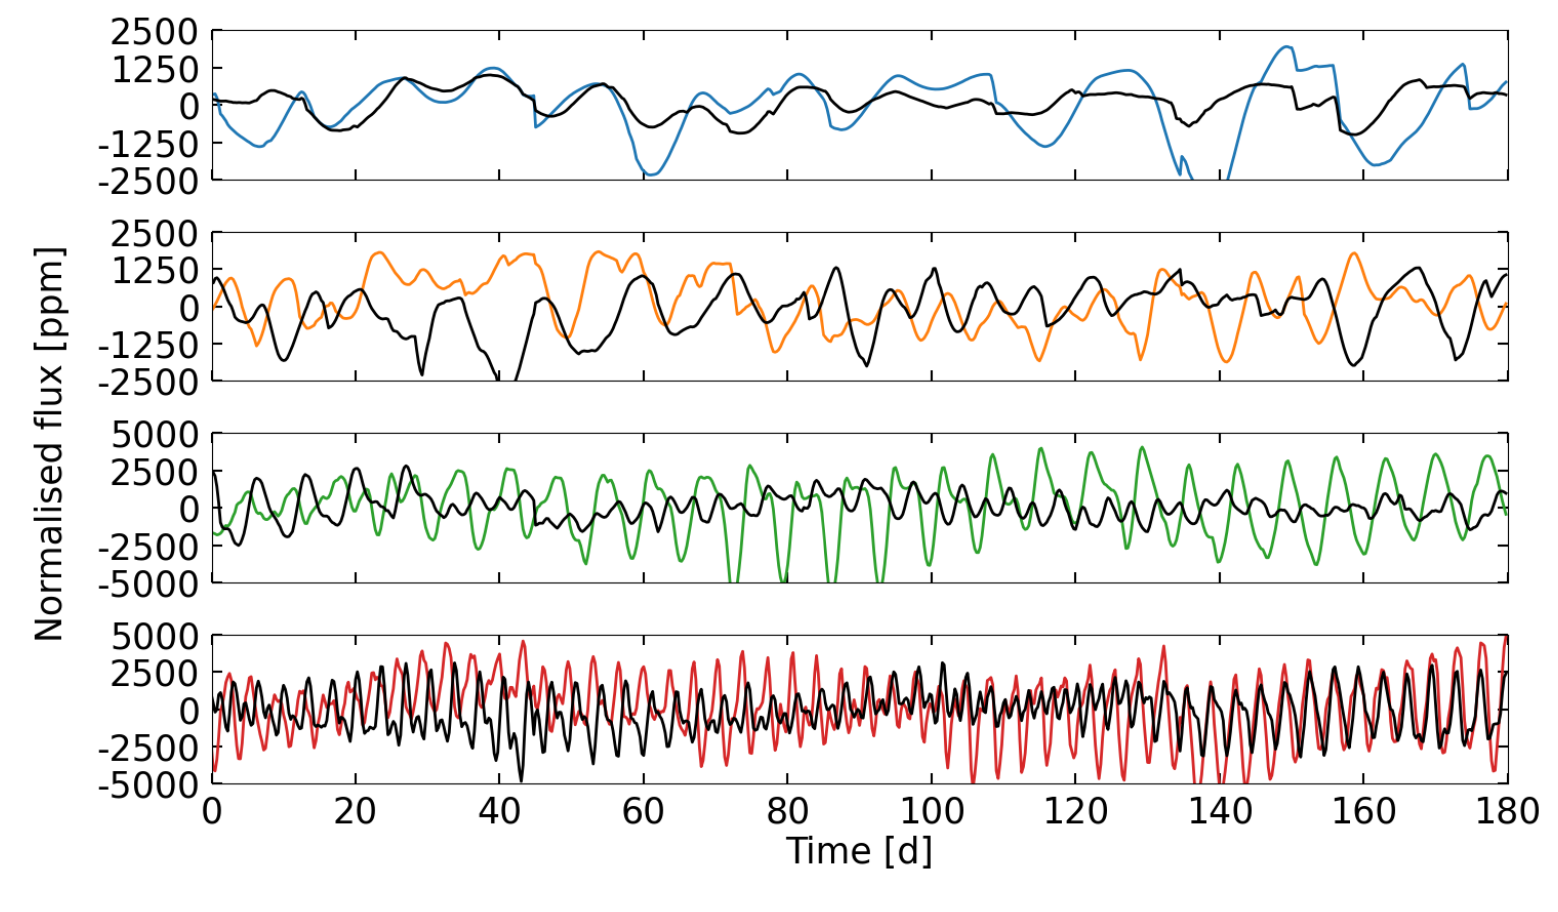
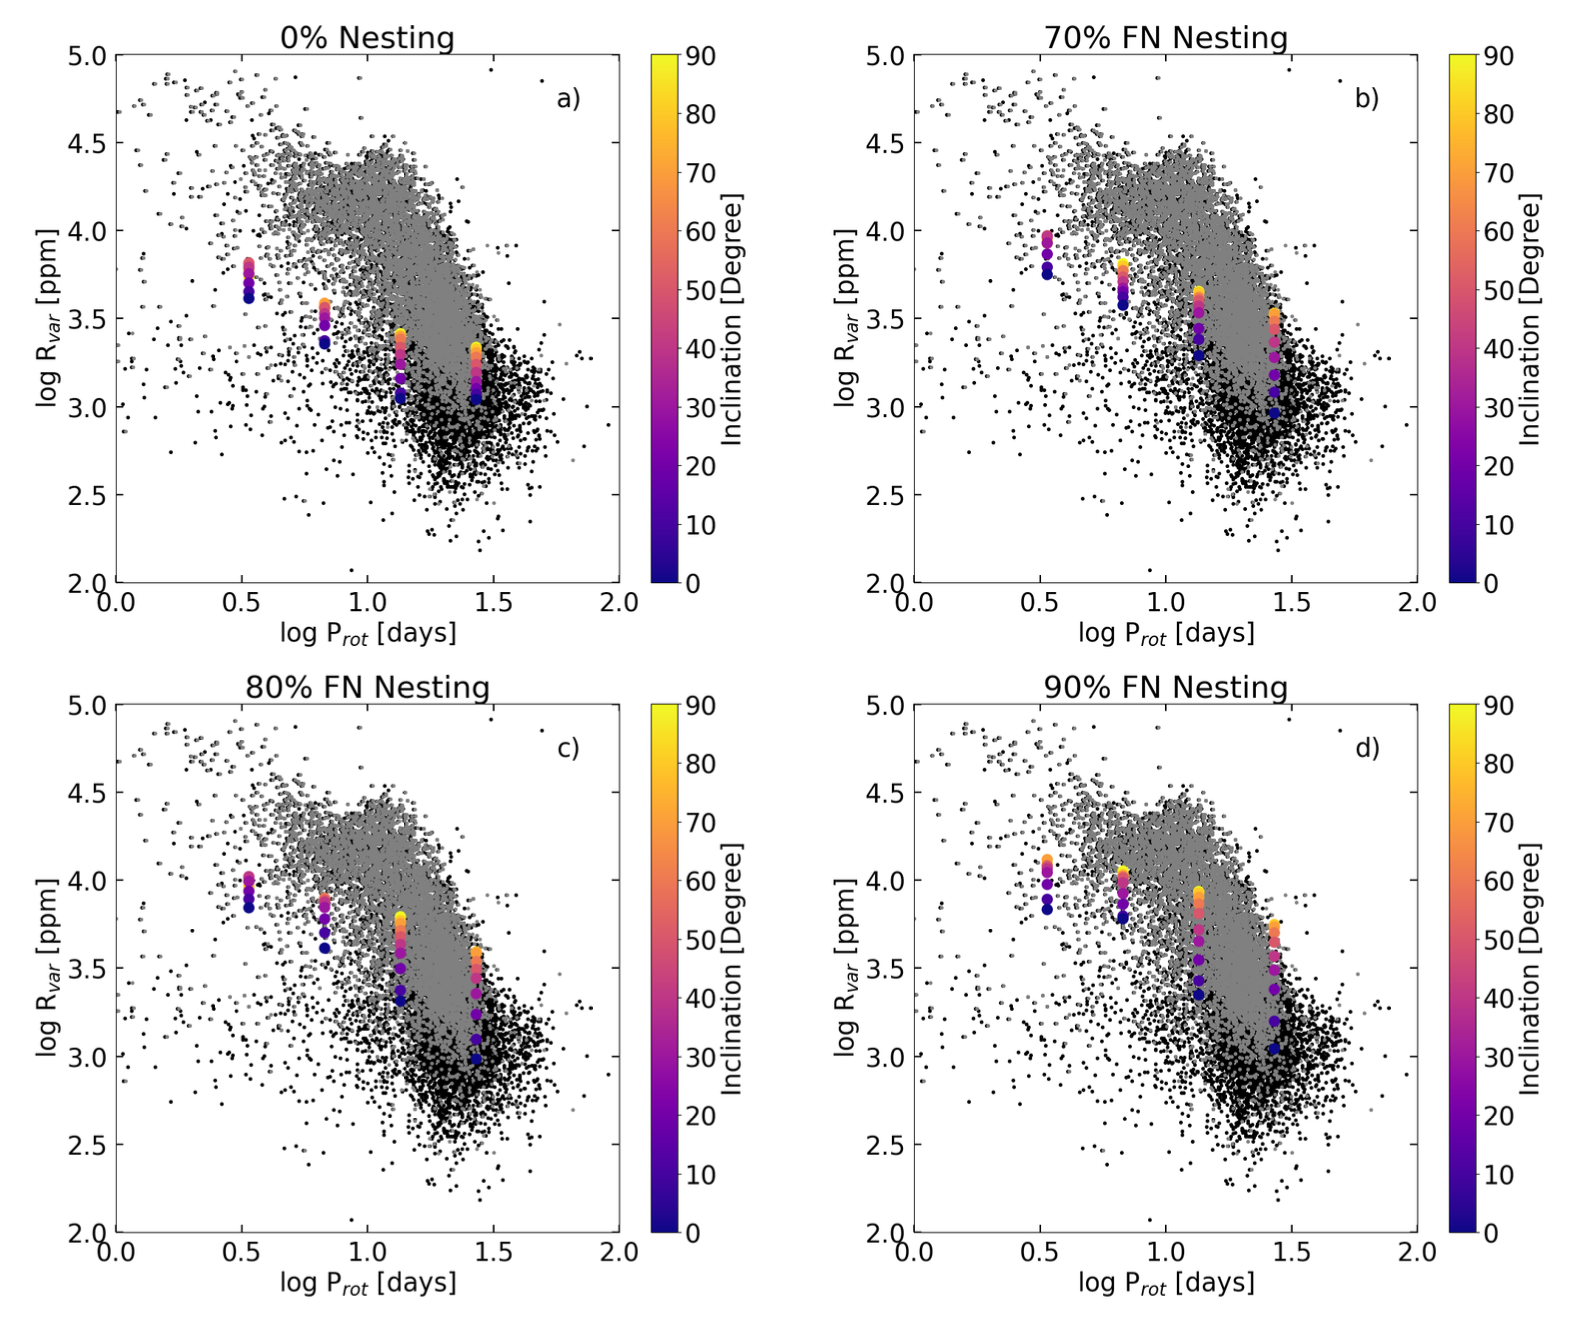
The upper panel shows light curves for 1-8 times solar rotation and activity level (from top to bottom). In each case the black and the coloured curves represent zero and 70% nesting, respectively. On the bottom panel, we show the observed (grey dots McQuillan et al. 2014, black dots Santos et al. 2021, using Kepler) and simulated (coloured dots; blue low, yellow high axial inclination) variability amplitudes as a function of the rotation rate.
Starspots and faculae are magnetic structures. They are responsible for the observed brightness variations on solar-type stars. As stars rotate, the disc-integrated brightness is modulated, showing temporal patterns that are related to the surface distribution and evolution of these features. To shed some light on solar-type stellar light curves ranging from very active, rapidly rotating stars to near-solar activity levels, we took the output of the FEAT models for solar to 8 times solar rotation rate and activity level (Işık et al. 2018, scroll below) and synthesised light curves. The study was led by Nina E. Nèmec, who developed a model to generate light curves using time-resolved full-surface maps of magnetic flux distribution from surface flux transport simulations. We showed that, the combined effects of increasing degree of nesting, the activity level, and the rotation rate have led to more regular light curves. In particular, the nesting tendency of active region emergence boosts up light-curve amplitudes.
Reference
Nèmec, N.-E., Shapiro, A.I., Işık, E., Solanki, S.K., Reinhold, T. 2023. Astronomy & Astrophysics, 672, A138
How spots survive on active suns, amid facular cannibalism (2022)
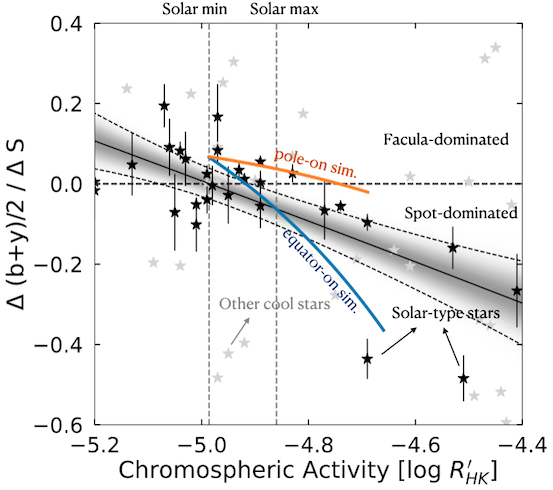
Activity-related brightening (positive) or dimming (negative), as a function of the mean chromospheric activity level. Blue and orange lines show the numerical simulation results for axial inclinations of 90˚ and 0˚. The stellar sample is from Radick et al. (2018), based on observations made at Lowell and Fairborn observatories. Black stars have effective temperatures ±200 K around the solar value and with relative brightening uncertainty below 0.01. Grey stars are the rest of the sample. The grey-shaded band is the posterior distribution of a Bayesian linear regression to solar-like sample using Gaussian priors for a quadratic function.
Solar-type stars undergo a change in their patterns of variability, as they get older and become less active. Such a low-activity star is our Sun, becoming slightly brighter when more active (every decade in the course of its activity cycle), due to a slight overcompensation of bright faculae to dark spots at its visible surface. Departing from the solar activity level towards more active solar-like stars, spots start to dominate faculae when the star gets more active. In this study, led by Nina E. Nèmec, we explained for the first time why this happens. By carrying out surface flux transport simulations at various activity levels (bipolar region emergence frequencies), we showed that, as the star gets more and more active, magnetic flux cancellation gets more efficient among the active-region network (responsible for faculae to appear near the solar/stellar limb) than for the spots, which occupy a smaller area fraction of active regions. As the flux emergence rate increases, facular cancellation dominates over spot cancellation, making stellar variability dominated by spots. In short, spots survive, while faculae kill each other! Let me speculate a bit: this finding is also an indication that ‘large starspots’ inferred on active stars are not likely to be big, monolithic monsters, but rather, constellations of sunspot-size spots extended over large portions of the star. For otherwise, spots would also eat up each other.
Reference
Nèmec, N.-E., Shapiro, A.I., Işık, E., Sowmya, K., Solanki, S.K., Krivova, N.A., Cameron, R.H., Gizon, L. 2022, Astrophys. J. Lett. 934, L23
Predicting astrometric jitter for Sun-like stars: fast-rotating suns (2022)
Application #3 of the FEAT model


Spot distribution from the FEAT simulation of a star that rotates 8 times faster than the Sun and also 8 times more active. Left: no nesting applied. Middle: active-longitude-type nesting. Right: Strong free nesting with a probability of 99%.

Absolute displacements of the photocentre owing to combined action of stellar magnetic activity and an Earth-mass planet orbiting the star, using Gaia-G passband and at an inclination of 60˚.
Young suns that rotate much faster than our Sun are interesting objects. They are much more active than the Sun. Also, the surface distribution of activity is different: we expect much more magnetic flux accumulated around the polar regions. Hence, the astrometric jitter signal we expect from those stars somewhat differs from that of a solar-like star (see the story just below this one). Using the FEAT platform, our team, led by Sowmya Krishnamurty (MPS), simulated astrometric jitter of such rapidly rotating active stars, as would be observed by Gaia and JASMINE (planned launch in 2028 by JAXA). We show that one can actually sense the increase of activity level with the rotation rate, along with the distribution of activity over the surface (eg, whether it is highly clumped or not). We also find that the jitter is dominated by spots and that faculae become inefficient at these rotation rates, owing to the high activity levels.
Reference
Sowmya, K., Nèmec, N.-E., Shapiro, A.I., Işık, E., Krivova, N.A., Solanki, S.K. 2022, Astrophys. J. 934, 146
Predicting astrometric jitter for Sun-like stars: effects of inclination, metallicity, and active-region nesting (2021)
Application #2 of the FEAT model
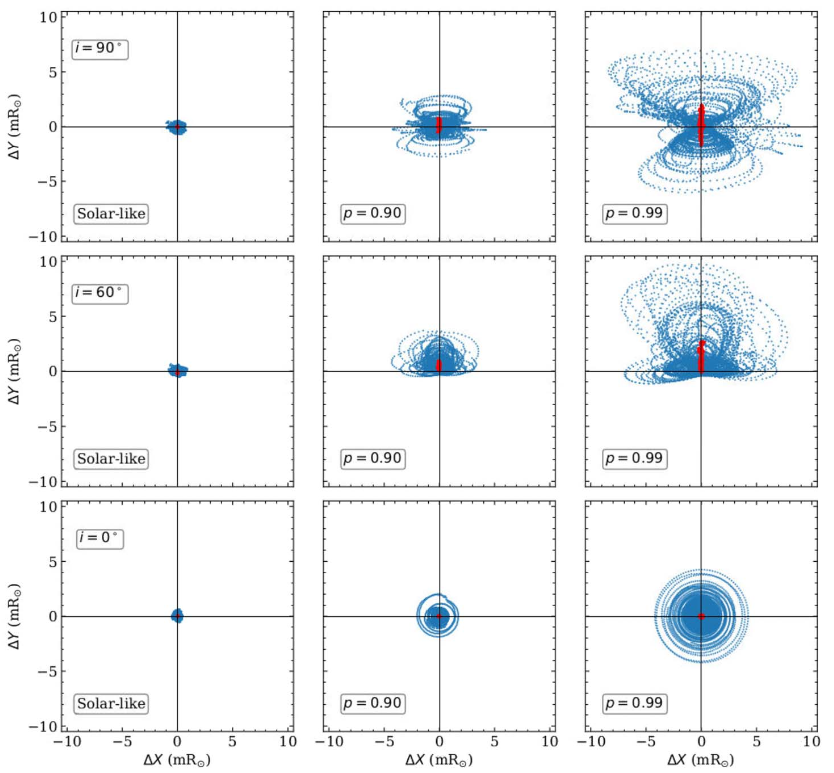
FEAT-based simulations of astrometric jitter for solar-like nesting (left column), a free-nesting degree of 90% (middle column) and 99% (right column). From top to bottom, the axial inclination amounts to 90˚, 60˚, and 0˚.
It is estimated that over 20,000 exoplanets are awaiting discovery, thanks to high-precision astrometry with the Gaia mission. In this series of studies, we show how this could be hampered by magnetic activity on the stellar photosphere. The idea is that surface inhomogeneities such as spots and faculae change the location of the photocentre on the celestial plane. So, variations in activity can also be possibly inferred from the jittering patterns of the photocentre. Using FEAT simulations at the solar rotation rate and activity level but with various degrees of active-region nesting, our team, led by Sowmya Krishnamurty (MPS), calculated the jittering motion of the photocentre as observed from a distance of 10 pc, at various axial inclinations and metallicity of the stellar atmosphere, deviating from the solar values. We found that the activity-induced astrometric jitter can interfere exoplanet-induced jitter, and that this effect increases with metallicity and active-region nesting.
Reference
Sowmya, K., Nèmec, N.-E., Shapiro, A.I., Işık, E., Witzke, V., Mints, A., Krivova, N.A., Solanki, S.K. 2021, Astrophys. J. 919, 94
Starspot distribution of the young solar analogue star EK Draconis (2021)
The first application of the FEAT model
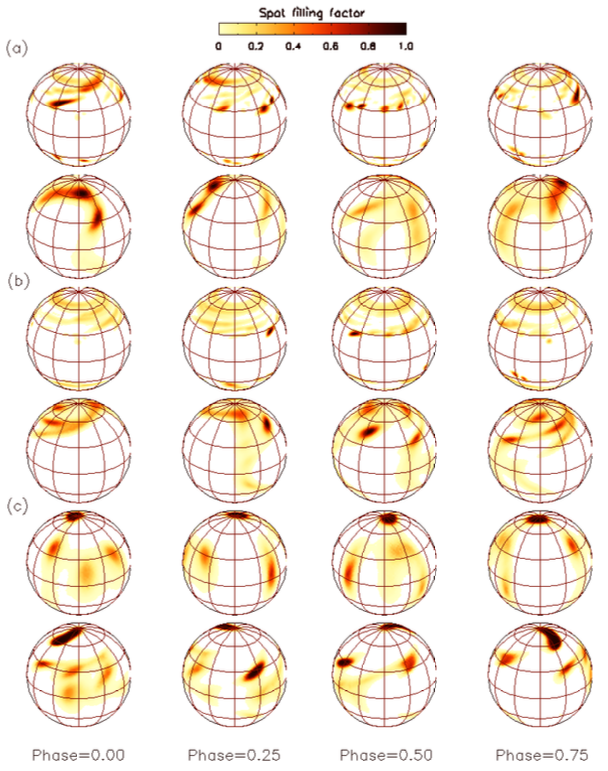
FEAT simulations and their reconstructions assuming two (panel a) and four (panel b) times the solar DR, in comparison to observed Doppler images of EK Dra for rigid-body and four times solar DR (panel c).
Using the FEAT framework, we set up surface brightness distribution snapshots of a Sun-like star rotating at a rate 9.6 times faster than the Sun — just at the rate of EK Draconis, a star with near-solar parameters, except for its young age (we found 27 Myr) and thus the rotation period (2.6 days compared to 25 days for the Sun). In our simulations, strong polar spots were formed from highly tilted bipolar regions emerging at mid- to high latitudes, owing to rotationally induced poleward deflection of rising flux tubes. This was also the case in the Doppler images obtained from spectra spanning 15 nights collected using the HERMES spectrograph at the Roque de los Muchacos Observatory in La Palma, Spain. However, the same Doppler images also showed signs of low-latitude spots, absent in our simulations. We then reproduced artificial Doppler images from our simulations, by taking into account different rates of surface differential rotation imposed in the physical simulation. In parallel, we carried out Doppler imaging by assuming the same differential rotation as in the simulation. When we compared the simulated and observational Doppler images, we found (1) a better match and (2) that those low-latitude features (especially those crossing the equator) were largely artefacts of the southern-hemisphere spot activity leaking into the more observable hemisphere.
Reference
Şenavcı, H.V., Kılıçoğlu, T., Işık, E., Hussain, G.A.J., Montes, D., Bahar, E., Solanki, S.K. 2021, Mon. Not. Roy. Astron. Soc. 502, 3343
Why is it so hard to detect rotational signals of Sun-like stars? (2021)
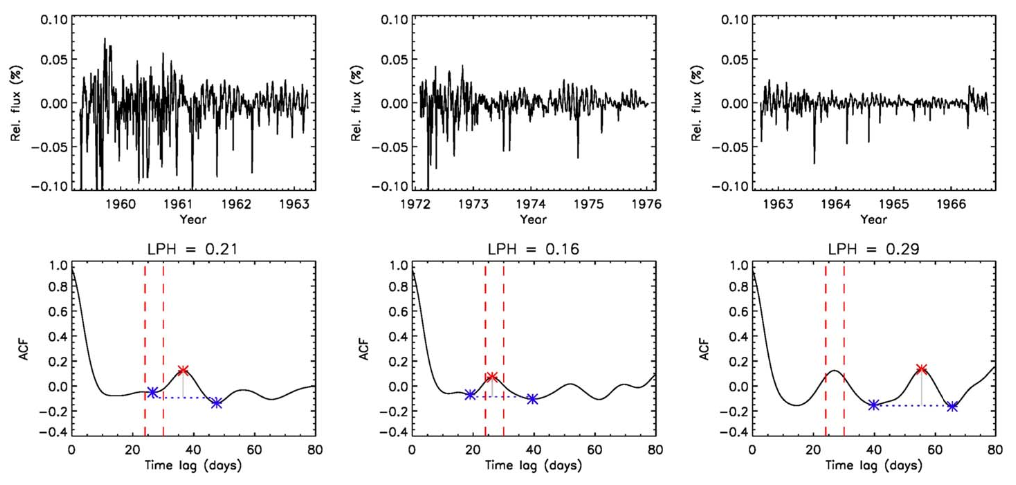
Early G-type stars with near-solar rotation periods, such as our Sun, are underrepresented in studies of stellar rotation periods derived from Kepler observations. Can the reason be the difficulty in estimating the correct periods of those stars? To investigate what is responsible for the lack of solar-like stars in Kepler rotation periods, our team led by Timo Reinhold (MPS) set up light-curve simulations of early G stars with solar rotation periods, as a function of axial inclination, metallicity, and brightness-dependent noise levels. Following 50,000 Monte Carlo runs of noise-free and noisy light curves with various parameters described above, we found that rotation period detectability was mainly hampered by the fact that the contributions of dark (spot) and bright (facula) features were comparable in magnitude, in addition to photometric noise. The figure above shows solar light curves (from SATIRE model) at three randomly chosen time frames (top panels), and the corresponding auto-correlation functions (bottom panels; red asterisk is the detected rotation period; vertical lines show the range of solar differential rotation).
Reference
Reinhold, T., Shapiro, A.I., Witzke, V.,Nèmec, N.-E., Işık, E., Solanki, S.K. 2021, Astrophys. J. Lett. 908, L21
What causes strong brightness variations in Sun-like stars? (2020)
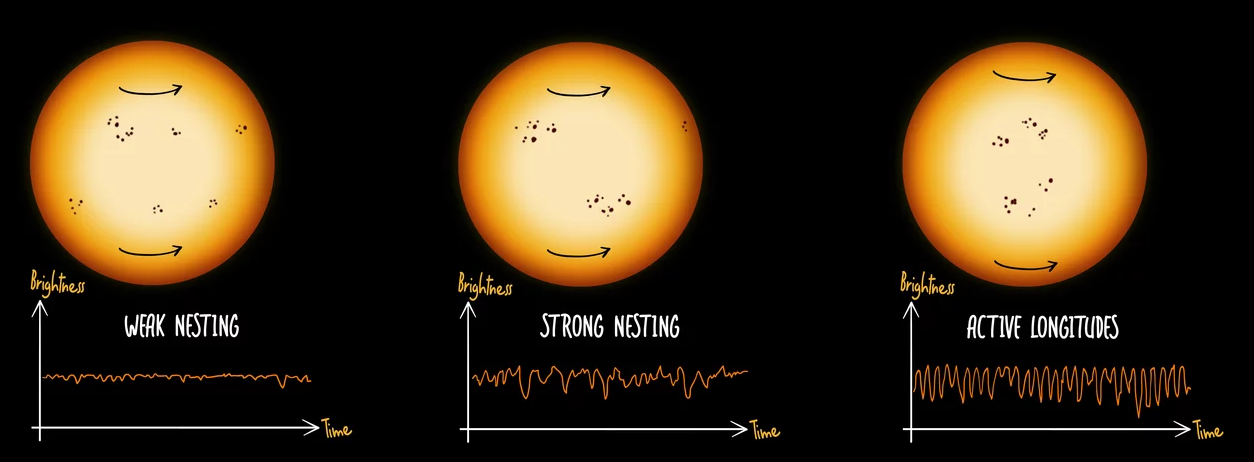
We designed numerical experiments of stellar variability in the rotational timescale, to predict the amplification and regularisation of brightness fluctuations in solar-type stars of similar age with the Sun. Our results showed the importance of active-region nesting, that we think can be responsible for the observations of the intriguingly strong and regular variability patterns of a sample of solar-like stars with the same rotation period as our Sun. For more details of our computational study, the link to the journal article and the press releases are given below.
Reference
Işık, E., Shapiro, A.I., Solanki, S.K., Krivova, N.A. 2020 Astrophys. J. Lett., 22 September 2020 (901, L21)
Press release at MPI for Solar System Research
Starspots: Revving up the Variability of Solar-like Stars
Press release at Boğaziçi University (in Turkish)
Güneş benzeri yıldızları Güneş’ten ayıran nedir?
How would the Sun “as a star” look like if observed by Kepler or Gaia? (2020)
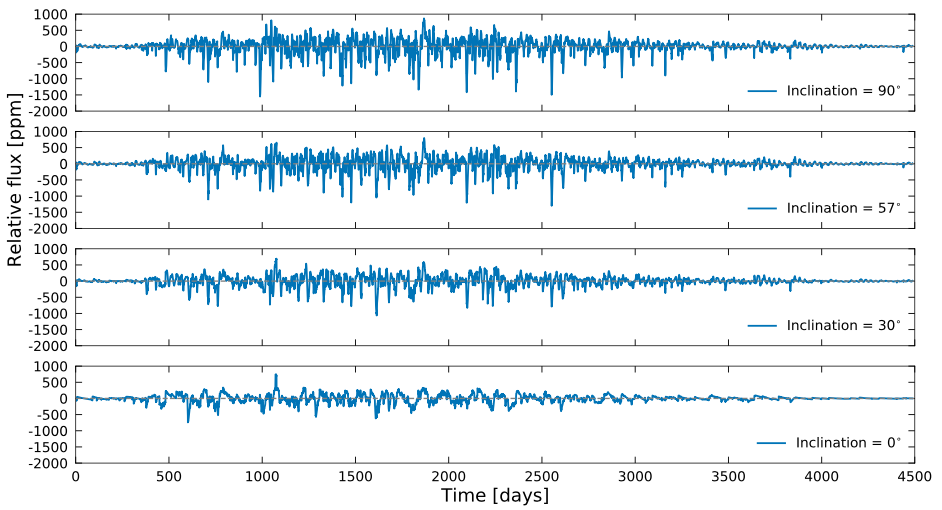
To better understand brightness variations of solar-type stars, it is instructive to view the Sun as a star. After all, we know in detail what is going on over its surface. In this study led by Nina Nèmec as part of her PhD thesis, we set up numerical simulations of the Sun’s brightness variations (its light curve), as seen from different perspectives with respect to its rotation axis, and through the sensitivity functions of space telescopes such as Kepler, Gaia, and TESS. It is generally assumed that solar brightness variations in Kepler and Gaia directly represent the solar irradiance variations (the total solar irradiance, TSI). Here we have shown quantitatively that this is a reasonable assumption. To conclude, we have shown that TSI is a good measure of solar variability, when considering the Sun among its stellar siblings. We also simulated (see the figure above) a decade-long light curve of the Sun for various inclinations of its rotation axis with respect to the line of sight, from 90˚ (Sun seen equator-on) to 0˚ (pole-on).
Reference
Nèmec, N.-E., Işık, E., Shapiro, A.I., Solanki, S.K., Krivova, N.A., Unruh, Y. 2020, Astron. & Astrophys. 638, A56
Modelling magnetic activity and starspot distributions on solar-type stars (2018)
Introducing the FEAT (Flux Emergence And Transport) model
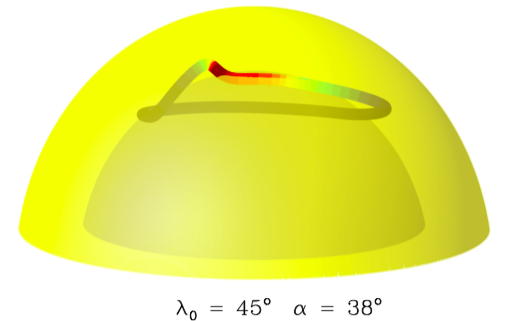
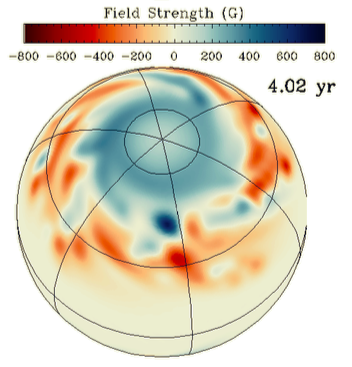
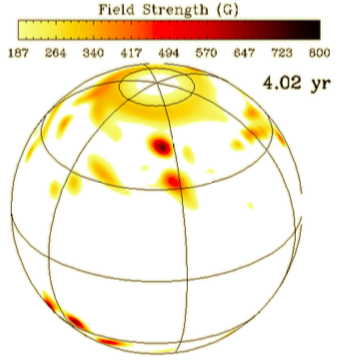
How did the Sun look like billions of years ago, when it was much younger? We know that younger G-K-type stars show magnetic features more towards higher latitudes and even at their poles, whereas the Sun has a very low average latitude of activity. So far, the latitudinal distribution of activity along with surface flux transport has not been systematically modelled. By using theoretical models and numerical simulations of magnetic flux emergence and global surface transport, we attempted the first such systematic models of Sun-like stars with gradually larger rotation rates, from the solar rate up to eight times faster and more active stars. We determined a criterion for starspot coverage based on the observed sunspot coverage, and used an empirical rotation-activity relationship to predict surface distributions and coverages of starspots. The modelling platform for global magnetic activity patterns we developed will be used to synthesise photometric light curves for comparison and a better understanding of stellar light curves, which are collected in large-scale surveys dedicated to exoplanet hunting, such as Kepler and TESS. The figure shows for a Sun-like star rotating 8 times faster and 8 times more active than the Sun (from left to right) the emergence of a magnetic flux tube with a high tilt angle of 38 degrees; the magnetic field pattern and the corresponding estimated starspot pattern from a snapshot near the maximum phase of its activity cycle.
References
Işık, E., Solanki, S.K., Krivova, N.A., Shapiro, S.K. 2018 Astron. & Astrophys. 620, A177
Işık, E., Solanki, S.K., Krivova, N.A., Shapiro, S.K. 2018 Proc. of 20th Workshop on Cool Stars, Stell. Sys., & the Sun
Revealing starspot activity and differential rotation on a K1 sub-giant star (2018)
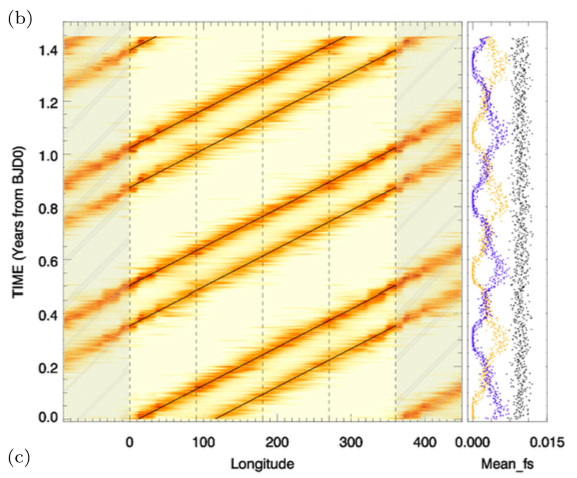
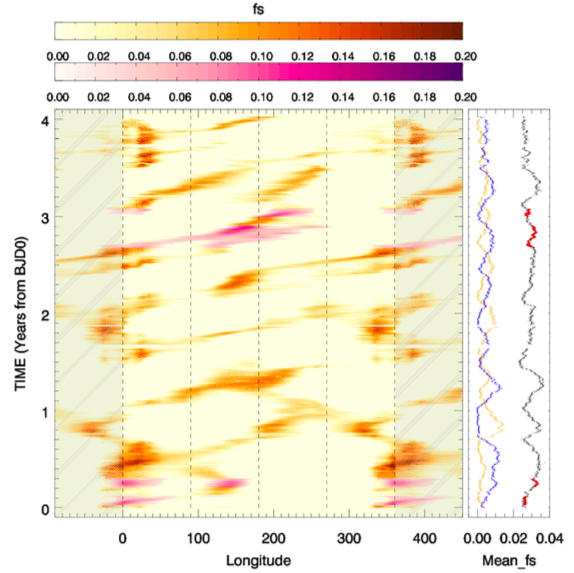
We carried out a detailed analysis of photometric data from the Kepler space telescope of an eclipsing close binary system, KIC 11560447. By designing numerical simulations of starspot distributions with the same stellar parameters, we demonstrated that it was possible to track the phase motion of starspots (in longitude) for up to 3 distinct spot clusters, amid a background of randomly emerging small-scale spots (see the figure on the left, for 2 input clusters). Then we inverted 2800 light curves of the system, to obtain a time-longitude map of the relative spot occupancy, which exhibited recurrent emergence of spot complexes, which drift with different phase speeds (see the figure to the right). Perhaps not surprisingly, both the simulation and observations showed the so-called flip-flop phenomenon for the hemispheric averages of spot occupancy (see right-hand panels on each figure). We used this information to obtain the relative rotation rates of these spots, which are presumably at different latitudes. We found a solar-like differential rotation whose rate is consistent with what we found by measuring slopes of drifting patterns in the above diagram.
References
Özavcı, İ., Şenavcı, H.V., Işık, E., Hussain, G.A.J., O’Neal, D., Yılmaz, M., Selam, S.O. 2018 Mon. Not. Roy. Astron. Soc., 474, 5534
Işık, E., Özavcı, İ., Şenavcı, H.V., Hussain, G.A.J., O’Neal, D., Yılmaz, M., Selam, S.O. 2018 IAU Symp. 340, Long-term Datasets for the Understanding of Solar and Stellar Magnetic Cycles, Cambridge U. Press, in press (see poster or arXiv preprint for a 2-page summary)
A combined model for magnetic field generation and transport in cool stars (2007, 2011)
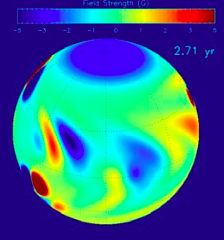
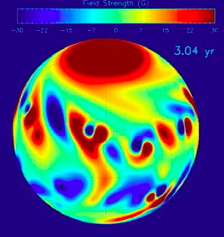
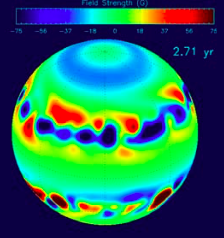
In my PhD thesis (2008), I have developed a unified model that considers physical processes for the generation, emergence, and surface transport of magnetic flux in the Sun and other cool stars. The ‘other’ cool stars that I first considered were Sun-like stars which rotate faster than the Sun, the so-called ‘young suns’ (for more information, see here). The figure shows snapshot magnetic field distributions on the surface of a Sun-like star, rotating at the solar rate, with a rotation period of 9 days, and 2 days. The saturation levels of the color scale representing the field strength is 5 G, 30 G, and 75 G from slow- to fast-rotating cases. The result I find the most interesting in this work is the case of a ‘flat-activity’ star showing no clear cycle signal, despite having a periodic dynamo in its interior (the middle panel above).
We applied the model to two additional stellar models that are interesting to observers of stellar magnetic activity: a K0V star with 2-day rotation period, and K1IV type subgiant with 2.8-day rotation period, similar to HR 1099.
References
Işık, E., Schmitt, D., Schüssler, M., 2007, Astron. Nachr., 328, 1111
[First results for Sun-like stars]
Işık, E., Schmitt, D., Schüssler, M., 2011, Astron. & Astrophys., 528, A135
[Detailed description of the combined model and application to G and K stars.]
Magnetic flux transport on active cool stars: lifetimes of starspots (2007)
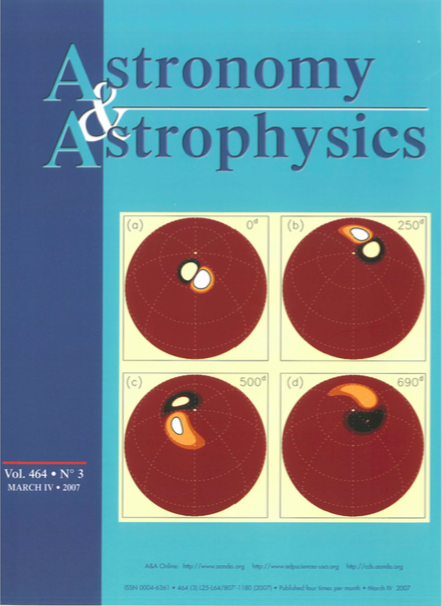
I carried out numerical investigations concerning the effects of large-scale surface flows on the lifetimes and structure of starspots. The image to the left shows the simulated evolution of a bipolar magnetic region (BMR) of the same fractional area of a large solar BMR, on a subgiant star of about 3 times the solar radius, and having the observed differential rotation of the active subgiant component of HR 1099. The structure emerges at 70 degrees latitude and lives for about two years. You may have a look on how the simulations give an idea about the formation/maintenance of a polar spot on a dwarf and on a subgiant star, when there is a supply of high-latitude flux due to random emergence of six tilted bipolar regions. Collaborators: M. Schüssler and S. K. Solanki. For another key result of the study, see here.
Reference
Işık, E., Schüssler, M., Solanki, S.K., 2007, Astron. & Astrophys. 464, 1049
